
Working with charts in Flutter can often feel limiting. While there are some solid charting libraries available, most fall short when it comes to rich interactivity or deep UI customization. On the other hand, charts built with shadcn/ui look polished out of the box — and if I need to tweak anything, I can. It’s just plain HTML + Tailwind, fully customizable.
✨ Thought Process
While Flutter has some good charting options, React (especially with shadcn/ui) offers:
- 🎨 Beautiful, flexible designs with Tailwind
- 🧩 Component-level control
- 🔧 Easy customization without limitations
So instead of embedding heavy chart logic in Flutter, I offload it to small, standalone React-built HTML files. I load them into Flutter using InAppWebView, and pass data from Dart dynamically.
This approach:
- 🚀 Keeps Flutter UI lean and focused
- 📦 Lets charts load only when needed
- 📈 Enables dynamic and interactive chart rendering
🏗 React + Vite Setup
npm create vite@latest react-chart-app --template react-ts
cd react-chart-app
npm install
🎨 Install shadcn/ui and Tailwind
npx shadcn-ui@latest initMake sure your tailwind.config.ts has:
content: ["./index.html", "./src/**/*.{js,ts,jsx,tsx}"],
theme: { extend: {} },
plugins: [],
Install tailwind:
npm install -D tailwindcss postcss autoprefixer
npx tailwindcss init -p
And update index.css:
@tailwind base;
@tailwind components;
@tailwind utilities;
📊 Install a chart library or use Shadcn’s Charts
We’re using shadcdn/ui:
npx shadcn@latest add chart🧱 Create a Chart Component
// src/components/BarChartApp.tsx
"use client"

import { Bar, BarChart, CartesianGrid, XAxis } from "recharts"

import {
  Card,
  CardContent,
  CardDescription,
  CardHeader,
  CardTitle,
} from "@/components/ui/card"
import {
  ChartConfig,
  ChartContainer,
  ChartTooltip,
  ChartTooltipContent,
} from "@/components/ui/chart"
import { useState, useMemo, useEffect } from "react"
import { ChartData } from "@/types/chart-data"

const chartConfig = {
  views: {
    label: "Page Views",
  },
  desktop: {
    label: "Desktop",
    color: "hsl(var(--chart-1))",
  },
  mobile: {
    label: "Mobile",
    color: "hsl(var(--chart-2))",
  },
} satisfies ChartConfig

export function BarChartInteractive() {
  const [activeChart, setActiveChart] =
    useState<keyof typeof chartConfig>("desktop")

  const [data, setData] = useState<ChartData[]>([]);

  const total = useMemo(
    () => ({
      desktop: data.reduce((acc, curr) => acc + curr.desktop, 0),
      mobile: data.reduce((acc, curr) => acc + curr.mobile, 0),
    }),
    [data]
  )

  // Expose to window for Flutter to call
  useEffect(() => {
    (window as Window & typeof globalThis & { updateChartData?: (newData: string) => void }).updateChartData = (newData: string) => {
      try {
        const parsed = typeof newData === "string" ? JSON.parse(newData) : newData;
        setData(parsed);
      } catch (e) {
        console.error("Error:", e);
        console.error("Invalid JSON from Flutter:", newData);
      }
    };
  }, []);

  return (
    <Card>
      <CardHeader className="flex flex-col items-stretch space-y-0 border-b p-0 sm:flex-row">
        <div className="flex flex-1 flex-col justify-center gap-1 px-6 pb-6 sm:pb-0">
          <CardTitle>Bar Chart - Interactive</CardTitle>
          <CardDescription>
            Showing total visitors for the last 3 months
          </CardDescription>
        </div>
        <div className="flex">
          {["desktop", "mobile"].map((key) => {
            const chart = key as keyof typeof chartConfig
            return (
              <button
                key={chart}
                data-active={activeChart === chart}
                className="relative z-30 flex flex-1 flex-col justify-center gap-1 border-t px-6 py-4 text-left even:border-l data-[active=true]:bg-muted/50 sm:border-l sm:border-t-0 sm:px-8 sm:py-6"
                onClick={() => setActiveChart(chart)}
              >
                <span className="text-xs text-muted-foreground">
                  {chartConfig[chart].label}
                </span>
                <span className="text-lg font-bold leading-none sm:text-3xl">
                  {total[key as keyof typeof total].toLocaleString()}
                </span>
              </button>
            )
          })}
        </div>
      </CardHeader>
      <CardContent className="px-2 sm:p-6">
        <ChartContainer
          config={chartConfig}
          className="aspect-auto h-[250px] w-full"
        >
          <BarChart
            accessibilityLayer
            data={data}
            margin={{
              left: 12,
              right: 12,
            }}
          >
            <CartesianGrid vertical={false} />
            <XAxis
              dataKey="date"
              tickLine={false}
              axisLine={false}
              tickMargin={8}
              minTickGap={32}
              tickFormatter={(value) => {
                const date = new Date(value)
                return date.toLocaleDateString("en-US", {
                  month: "short",
                  day: "numeric",
                })
              }}
            />
            <ChartTooltip
              content={
                <ChartTooltipContent
                  className="w-[150px]"
                  nameKey="views"
                  labelFormatter={(value) => {
                    return new Date(value).toLocaleDateString("en-US", {
                      month: "short",
                      day: "numeric",
                      year: "numeric",
                    })
                  }}
                />
              }
            />
            <Bar dataKey={activeChart} fill={`var(--color-${activeChart})`} />
          </BarChart>
        </ChartContainer>
      </CardContent>
    </Card>
  )
}
📦 Build It to a Single File
Install:
npm install vite-plugin-singlefile --save-devUpdate vite.config.ts:
import { defineConfig } from 'vite'
import react from '@vitejs/plugin-react-swc'
import tailwindcss from '@tailwindcss/vite'
import path from "path"
import { viteSingleFile } from 'vite-plugin-singlefile'

// https://vite.dev/config/
export default defineConfig({
  plugins: [react(), viteSingleFile(), tailwindcss()],
  resolve: {
    alias: {
      "@": path.resolve(__dirname, "./src"),
    },
  },
})
Run:
npm run build🎉 Now your chart is inside one HTML file → dist/index.html
📱 Flutter Setup with InAppWebView
Add dependency:
flutter_inappwebview: ^6.1.5Update pubspec.yaml
flutter:
  assets:
    - assets/chart/index.html
🚀 Load HTML in Flutter
final chartData = [
{"name": "Jan", "value": 120},
{"name": "Feb", "value": 90},
];
InAppWebView(
initialFile: "assets/chart/index.html",
onWebViewCreated: (controller) {
controller.evaluateJavascript(
source: "window.updateChartData(${jsonEncode(chartData)});"
);
},
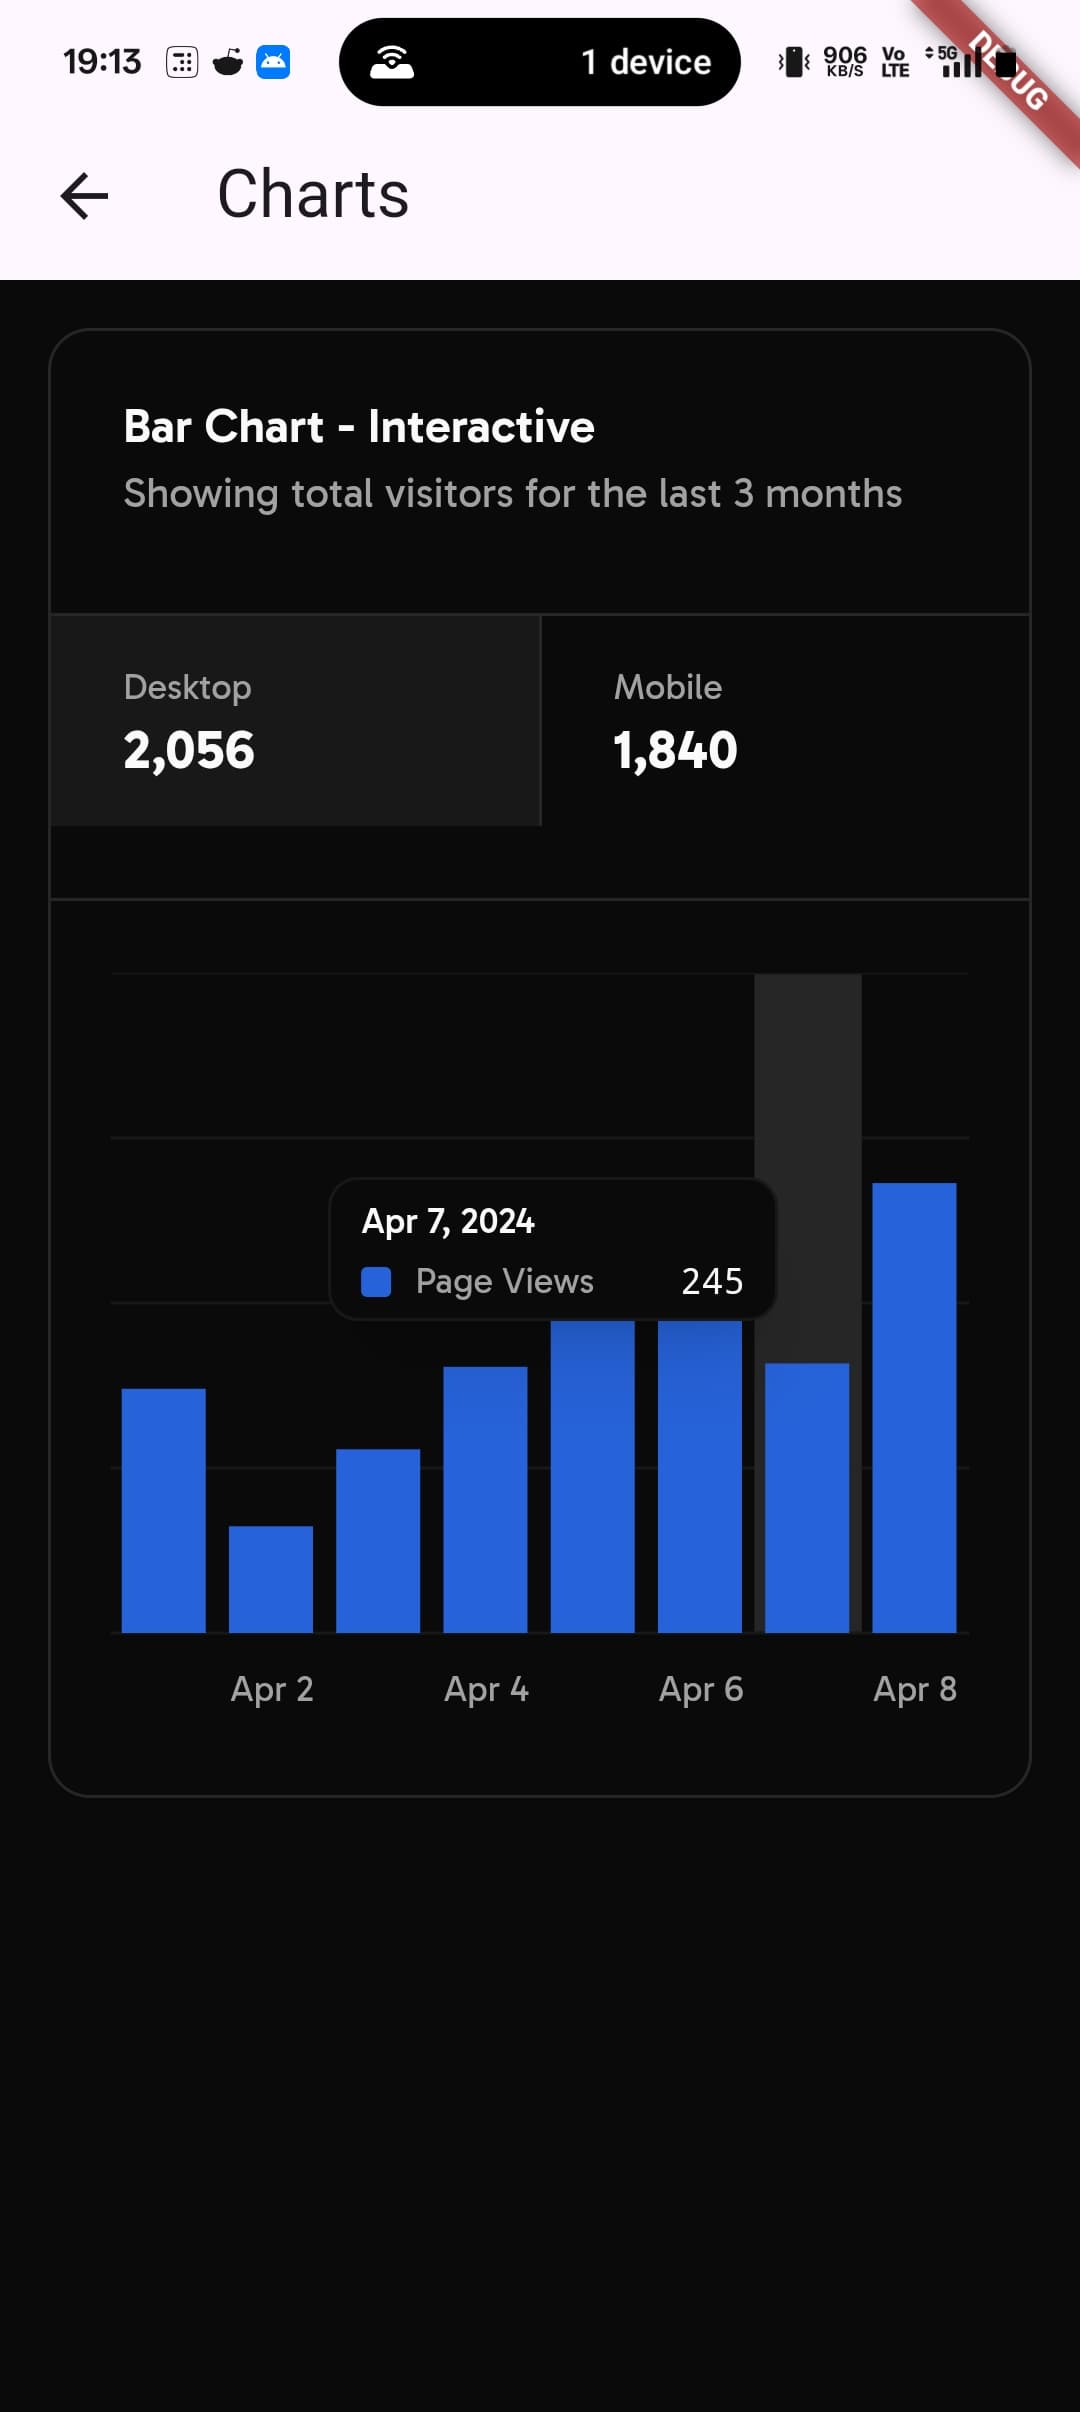
)🎉 Now your Flutter app is running a full shadcn + Tailwind chart, with dynamic data injection.
⚠️ Caution: Theme Clash
If you’re using MaterialTheme in Flutter and shadcn (Tailwind-based) in React:
- Ensure colors, font sizes, and spacing align
- Avoid jarring UI differences between embedded chart and the Flutter screen
🔧 Sync your tokens or define a shared design system
💥 Why This Is Engineering, Not Just Development
Engineers compose reusable systems, not just components.
With this pattern, you’re:
- Creating modular, platform-independent chart UIs
- Keeping your main app focused and performant
- Preparing for dynamic updates or AI-driven visualizations
🔮 Future: Per-Chart HTMLs (On-Demand)
Why load all charts into one file?
Build multiple HTMLs — one per chart type:
bar_chart.htmlline_chart.htmldonut_chart.html
Then load only what’s needed in Flutter:
initialFile: "assets/charts/${widget.chartType}.html"🙌 TL;DR
✅ React + Tailwind for beautiful chart UIs
✅ Embed in Flutter via InAppWebView
✅ Inject real-time or dynamic data from Dart
✅ Build per-chart HTMLs for lightweight, modular design
Github 👉 shad-chart-template